

Provide value for money
What we said we’d do
Through our business planning process, including submission to Ofgem and the negotiation of the RIIO-T2 deal, we had value for money at the heart of it all. We want to deliver a clean, fair and affordable electricity network for all.
What we have done and what we’re going to do
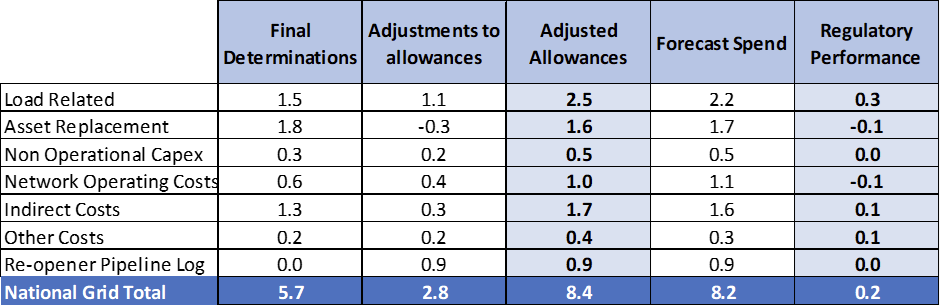
We send a report to Ofgem each July sharing information about our work in RIIO-T2. A main part of that report are data tables called the Cost & Volume tables. In the latest report, we show forecast expenditure of £8.2bn against Final Determination Allowances of £5.7bn – a difference of £2.5bn. Since Final Determination, there have been updates to allowances to reflect our latest view of movements including re-openers submitted, the operation of uncertainty mechanisms and anticipated end of price control adjustments via Price Control Deliverable (PCD) mechanisms. These updates add a further £2.8bn of allowances over the price control period, bringing forecast expenditure to £0.2bn less than these adjusted allowances for the 5-year price control period. The adjustments to allowances by investment area are summarised in the table below:
Regulatory Financial Performance Reporting (RFPR)
This is our Regulatory Financial Performance Reporting (RFPR) submission to Ofgem. RFPR contains our financial performance for 2024/25 under the RIIO framework. RFPR enables Ofgem to administer the licence conditions that relate to the price control. This includes monitoring the performance of licensees against Final Determinations, monitoring compliance with price control obligations and reviewing performance between price controls.
Download the 2024/2025 RFPR narrative
Download the 2024/2025 RFPR pack
Archive
Download the 2023/2024 RFPR narrative
Download the 2023/2024 RFPR pack
Download the 2022/2023 RFPR narrative
Download the 2022/2023 RFPR pack
Regulatory reporting – spend and allowance
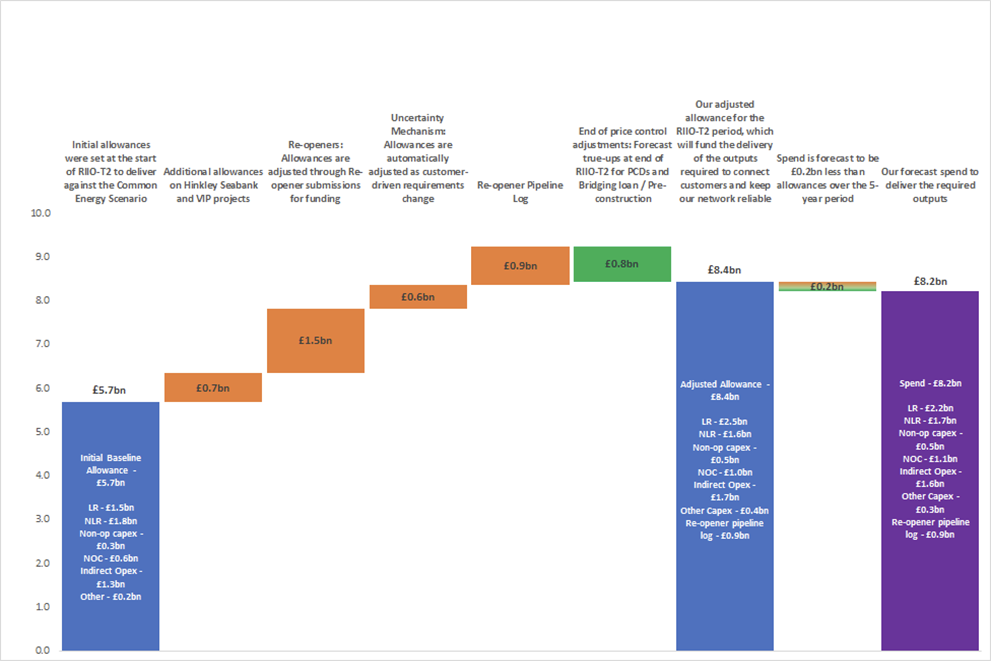
The following graphic shows the five-year forecast and demonstrates how the price control mechanisms operate to adjust allowances from Final Determinations as requirements change. The graphic also demonstrates the corresponding impact on the overall difference between spend and allowance. NB this waterfall excludes forecast spend and agreed funding for ASTI projects to align with the submitted Cost & Volume tables.
Spotlight on five-year and 2024/25 views of performance
Load-Related 5-year view
The Load-Related plan, that is the work to connect customers to the network and make wider network reinforcements, is forecast to deliver the outputs required to meet customer needs for £2.2bn of direct capital expenditure, £0.3bn less than the allowances of £2.5bn after the adjustments to allowances have been factored in.
In the Load-Related portfolio, we have analysed the differences between spend and allowance in order to categorise it as either:
- Efficiency or inefficiency - includes projects with specific examples where costs increased or decreased as a direct result of our action.
- External factors outside of our control - will include projects where changes have resulted due to changing customer or ESO requirements.
- Assumptions made within the price control settlement that have varied against the actual position - will include cost changes resulting from changes in scope that has not been subject to a change in customer or ESO requirements, or where the allowance mechanism has changed.
Based on the above methodology, the £317m difference between cost and allowances has been allocated in the following manner.
Investment Category | Efficiency | External Factors | Change in Assumptions | Total £m |
Demand | 5.3 | 52.1 | 19.8 | 77.2 |
Generation | 0.0 | -40.5 | 29.5 | -11.0 |
General Wider Works | 0.0 | -10.6 | 29.2 | 18.6 |
Wider Works | 4.1 | 149.4 | -14.5 | 139.0 |
Pre-construction | 52.0 | -2.2 | 14.5 | 64.3 |
Large Onshore Transmission Investments | 0.0 | 25.3 | 0.0 | 25.3 |
Hinkley to Seabank new OHL and substations | 0.0 | -21.8 | 0.0 | -21.8 |
Multi-Driver Project | 0.0 | 0.0 | 7.0 | 7.0 |
Sub-total | 61.4 | 151.7 | 85.5 | 298.6 |
Avoided / Deferred Investment | 12.1 |
|
|
|
Total | 73.5 | 151.7 | 85.5 | 310.7 |
Load-Related 2024/25 Performance
In 2024/25, direct capital expenditure on the Load-Related portfolio was £602m which is broadly in line with adjusted allowances of £606m. Differences between within year expenditure and allowance for each investment category are driven by misalignment between the phasing of expenditure and allowance within the period (as is the case with the 5-year view). It is largely coincidental that the allowances and expenditure are similar values in 2024/25.
Asset Health Related 5-year view
The 2024/25 asset health related plan, which is our work to replace or refurbish existing equipment on the transmission network, shows a forecast spend of direct capex £1.7bn over the RIIO-T2 period, which is £146m more than adjusted allowances of £1.6bn. The adjusted allowances reflect our latest view of allowances, a £0.2bn reduction since the start of RIIO-T2 reflecting reductions for work not now forecast to be completed, balanced with additional allowances agreed through re-openers. The net £146m overspend has been predominantly driven by:
- £142m spend on delivery of outputs outside the RIIO-T2 submission. These are not RIIO-T2 regulatory outputs and have no baseline allowances and therefore appear as overspend.
- £27m overspend on Dinorwig-Pentir cable and Dinorwig substation. This has resulted due to delays to delivery driven by additional testing required and realignment of plans for interactions with Heritage Lake Railway and some additional surveys and environmental consultations.
- There is also a £34m overspend associated with the replacement of assets like Transformers, Reactors, Circuit breakers, Overhead line fittings and Cables. This is mainly occurring in the circuit breaker category and London Power Tunnel phase 2 (LPT2) project where earlier delivery has moved decommissioning costs from RIIO-T3 into RIIO-T2.
The above overspends are offset by an underspend of £63m on our RIIO-T2 mechanistic Price Control Deliverables (PCD) categories for assets that have an agreed volume of replacements and refurbishments to carry out in RIIO-T2. This underspend is specifically Protection & Control and Overhead Line Conductor where we have implemented initiatives like bulk procurement frameworks, self-delivery models and scope standardisation. The table below reports the £146m overspend against allowance by the performance drivers of Efficiency, External Factors and Change in Assumptions:
Asset Health | Efficiency | External Factors | Change in Assumptions | Total £m |
Baseline (substation cable, condition monitoring, tower painting, spares, tunnels, through wall bushings) | 9 | 0 | -11 | -2 |
NARM (Transformers, Reactors, Circuit breakers, Overhead line fittings and Cable replacements) | 7 | 19 | -47 | -22 |
London Power Tunnels | 0 | 0 | -12 | -12 |
Price Control Deliverables (Bay assets, Instrument Transformers, Overhead line conductors Protection & Control, SF6 Interventions | 46 | 0 | 17 | 63 |
Use it or lose it (UIOLI) | -5 | 0 | 0 | -5 |
Dinorwig Pentir cable and substation re-opener | -27 | 0 | 0 | -27 |
Costs Outside Submission (completion of interventions from RIIO-T1) | 0 | 0 | -142 | -142 |
TOTAL | 30 | 19 | -196 | -146 |
Asset Health 2024/25 Performance
In 2024/25, direct capex expenditure on the Asset Health Related portfolio was £321m which is £8m more than adjusted allowances of £313m. This difference between spend and allowance is predominantly driven by the following:
- The misalignment and incomplete allowance adjustments within year which makes any comparison misleading; at the end of the price control period, the framework will adjust allowances for any volumes not delivered.
- Volume reductions due to delivery challenges and changes to drivers for investment. For instance, a 177km reconductoring scheme has been superseded by load-related investments and therefore removed from the asset health plan.
- The net impact of revised cost forecasts (some increasing and some decreasing) based on increased experience of delivery and further development of projects.
Non-Operational Capex 5-year and 2024/25 view.
Our Non-Operational capex is spend on IT, Property and Fleet. The Non-Operational spend for the RIIO-T2 period is £460m against allowances of £432m. Underspend against allowances in early years because of rephasing the delivery of some of the IT and Fleet investments is offset by increased spend in 2024/25 and the forecast for the final year of RIIO-T2 leading to overall underperformance.
For our IT investments, excluding the significant re-openers of Supervisory Control and Data Acquisition (SCADA) and Electricity Transmission Control Centre (ETCC), we are forecasting RIIO-T2 spend of £265m against allowances of £242m, an overspend of £23m for the IT part of non-operational capex. This overspend is driven by additional investment in IT capabilities to support the delivery of the significant portfolio of ASTI investments.
In terms of our investments in the Property portfolio, we are forecasting an overall £9m spend which is line with allowances. However, for the Fleet portfolio, we are forecasting an overspend of £4m due to an increase in costs for installing almost 1,500 EV chargers across our office and substation estates.
Network Operating and Indirect Costs 5-year and 2024/25 view.
Network Operating Costs (NOC) are the total spend on faults, inspections, repairs and maintenance, vegetation management and legal and safety. Spend is forecast to be £762m, which is £108m higher than the adjusted allowance position of £654m for the RIIO-T2 period. The main drivers for this difference between spend and allowance are £61m overspend on legal and safety (predominantly flood defence work), a £33m overspend on own-use electricity at substations and a £38m overspend on Repairs. This is offset by £31m underspend in other NOC categories.
In 2024/25, the total spend was £152m which is £29m more than allowances; this is mainly due to an overspend in flood defence work of £16m, an increase in own-use electricity costs at substations (£5m) along with an overspend of £9m within the Repairs category. This overspend is partially offset by a £3m underspend on Inspections.
Across RIIO-T2, Indirect and Closely Associated Indirect (CAI) costs (collectively ‘Indirects’) are forecast to be £1.57bn against total allowances of £1.64bn. Total adjusted allowances include £0.3bn resulting from the adjustments relating to the LOTI Hinkley Connection and LOTI Harker Energy Enablement Projects along with the consequential costs of the NESO separating from the National Grid Group allowances in Business Support. The resulting underspend of £66m (6.9% variance to allowances) is split between CAI underspend of £88m and Business Support overspend of £22m.
Impact on domestic consumer bills
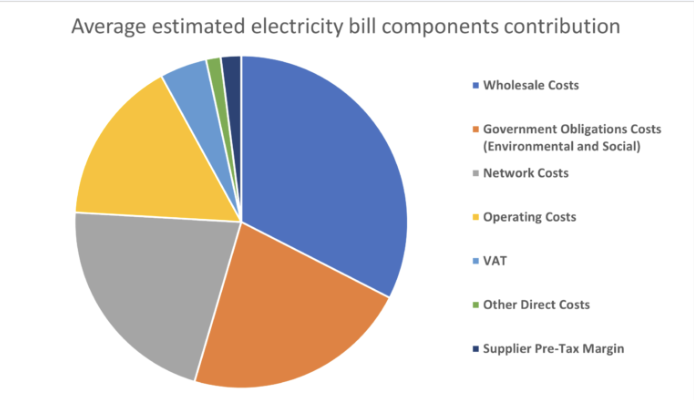
Our revenues are recovered through the NESO charging our customers for the services we provide. Network costs for both transmission and distribution are reported to make up around 20% of the domestic electricity bill. Of this total bill, £19.22 is attributable to National Grid’s Transmission Owner costs which equates to 1.8% of the average annual domestic electricity bill.
Ofgem’s RIIO-T2 framework ensures that two-thirds of any efficiency savings that we have delivered are passed onto customers resulting in lower network charges, and therefore lower electricity bills for the end consumer. In addition, consumers are benefiting from the wider value that investment in our network supports in terms of facilitating an energy sector which is less reliant on imported fossil fuels, which will in turn lead to lower and less volatile end-consumer prices.