
4 ways lockdown life affected UK electricity use
COVID-19 has transformed many aspects of our lives, from where we work to how we rest and play. As restrictions ease, we look back at ways our electricity use changed through the pandemic, how it continues to evolve and what this tells us about the last few months.
The UK’s electricity use has reflected some of the unprecedented changes we’ve experienced due to the COVID-19 pandemic – from TV pickups and clapping for carers, to the ‘lockdown lie-in’. We saw the ‘stay at home’ peak in April, followed by staged easing of restrictions from mid-May onwards. Here we reveal four surprising ways that this has impacted our use of energy.
1. Traditional TV pickups made a comeback
Before the advent of box sets and streaming services like Netflix, popular programmes watched by most of the nation would commonly cause what our energy experts call a ‘TV pickup’. This occurs when millions of people watch a particular programme or TV event and then, when it ends, go to the kitchen to turn kettles and ovens on all at the same time.

Some of the most significant past pickups have included royal weddings and those all-too-rare occasions when the England football team has reached the latter rounds of the World Cup. In fact, the most watched UK TV programme ever was the 1966 World Cup final.
During ‘peak lockdown’ from late March to mid-May, it’s safe to say that more of us were sitting at home than ever in UK history; and many of us watched specific programmes in ‘real time’, when they were actually broadcast. Boris Johnson’s speech to the nation on 10 May drew in a staggering 27.5 million viewers, while on 5 April the Queen’s address attracted 24 million people.
The National Energy System Operator (NESO) saw how these big viewing figures impacted electricity usage, for example with a 500-600MW pickup at the end of the Queen’s address. This is equivalent to 300,000 people heading into the kitchen afterwards to make a cuppa.
2. Clap for carers caused a spike in demand
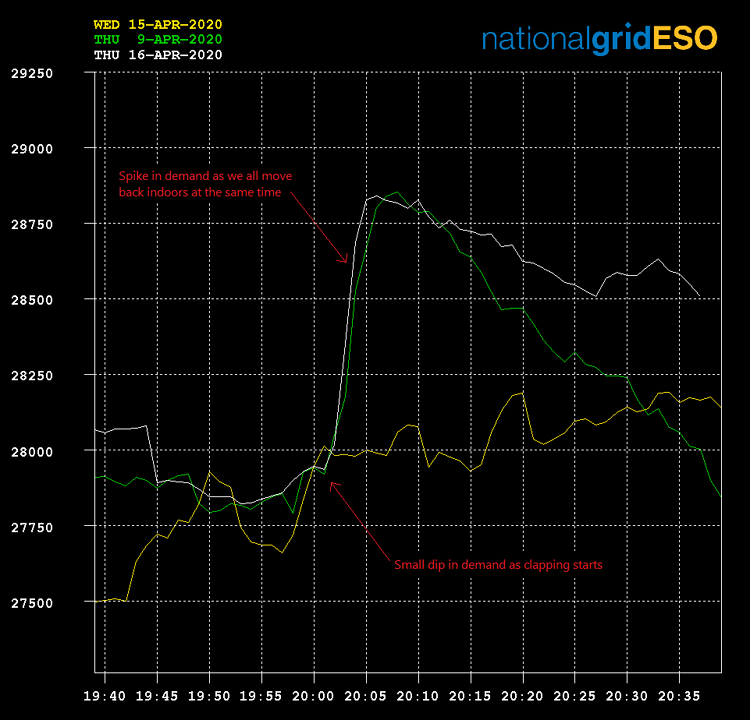
As well as being a way to thank the NHS, ‘clap for carers’ on Thursdays at 8pm became a weekly ritual for many of us, amid days that felt like they blurred into one. And it was a chance to wave at the neighbours (actual human beings from outside your own family ... the novelty!). So many people participated in this that when we all went back inside after clapping there was a spike in electricity demand.
This below chart clearly shows ‘clap for carers’ spikes on Thursdays 9 and 16 April, compared to a normal weekday around that time (Wednesday 15 April), which had a smoother profile of usage.

3. Lockdown lie-ins: the morning peak moved later during lockdown
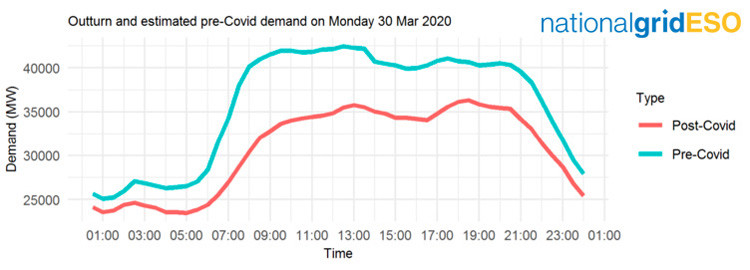
With the kids off school and far greater numbers of adults working from home, our morning routines changed. Commuting only as far as from the bedroom to the kitchen table or getting the children up just in time to do a daily Joe Wicks workout, rather than for the school run, meant later starts for many and more variation in when we all got up and going for the day. NESO’s chart below shows an almost 18% drop in morning demand and more even use instead of the usual relatively steep increase between 5am to 8am.

4. Drastic drop in demand is now returning to new normal
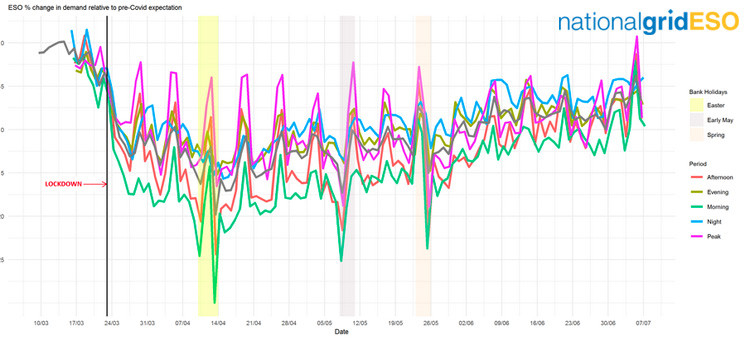
Demand for power fell by as much as 20% during lockdown, reaching its lowest around the Easter weekend (11/12 April). Since then it’s been slowly creeping back up towards pre-COVID levels and is now only a few percentage points down on ‘normal’ patterns. Interestingly, the chart below reflects how demand dropped relatively sharply after lockdown was announced on 23 March, but recovery was more gentle as restrictions were lifted in stages.


